
English is the most-spoken language in the world, not because of the number of native speakers, but because of the large number of people who speak English as a second or additional language.
In fact, almost 75% of the world’s English-speaking population are non-native speakers, and millions more are in the early stages of learning the language.
This article presents a convenient, curated list of statistics on learning English and speaking English as a second language. We look at English language learners in the US and worldwide, as well as some fascinating facts relating to non-native English speakers.
Top statistics about learning english as a second language
- As many as 1.9 billion people speak English as a second language.
- 10.3% of students enrolled in US public schools are English language learners.
- 75% of English learners in the US speak Spanish as their home language.
- Of all the countries that speak English as a second language, the Netherlands has the best proficiency score.
- The global English language learning market will be worth an estimated $42.1 billion in 2024.

Statistics about English language learners in the US
(Jump straight to global ESL statistics here)
Before we continue with these English language learner statistics, it’s worth noting that the definition of an English language learner (ELL) or English learner (EL) varies between US states.
You can find a full list of definitions by state here, but they mostly include students:
- Up to age 21
- Enrolled or preparing to enroll in an elementary or secondary school
- Whose native/home language is not English
- Whose limited English proficiency means they will have difficulties participating in classwork or achieving acceptable grades
What percentage of US students are English language learners?
The most recent data published by the National Center for Education Statistics (NCES), for 2020, shows that of the 48 million students enrolled in public elementary and secondary schools, 10.3% (around 5 million) are classified as English learners.
Here is a table showing the breakdown of ELL students by grade:
| Grade | Number of EL students | As percent of total students in grade |
|---|---|---|
| Kindergarten | 555,599 | 12.9% |
| Grade 1 | 554,566 | 15.0% |
| Grade 2 | 549,027 | 14.7% |
| Grade 3 | 521,480 | 14.4% |
| Grade 4 | 475,765 | 13.3% |
| Grade 5 | 430,399 | 11.2% |
| Grade 6 | 372,575 | 9.9% |
| Grade 7 | 332,877 | 9.0% |
| Grade 8 | 299,022 | 8.1% |
| Grade 9 | 326,386 | 7.7% |
| Grade 10 | 269,559 | 7.4% |
| Grade 11 | 219,090 | 6.4% |
| Grade 12 | 199,082 | 5.6% |
As you can see, the percentage of ELL students in each grade decreases as they reach the upper grades and some are reclassified as proficient English speakers.
In 2010, 9.2% of US public school students were English language learners, and in 2000, they made up 8.1% of public school enrollment.
In the 2020-21 school year, 67.3% of all public school teachers had at least one EL student in their classroom. For private schools, this number was just 20.8%.
In public schools, there are English language learners in 64.6% of elementary classrooms and 70.1% of secondary classrooms.
Department of Education statistics for the 2015-16 school year show that 84% of high school students graduated within 4 years. However, only 67% of English language learners graduated successfully in this timeframe, compared to 85% of non-EL students.
Still, this represents an increase in the rate of English learners graduating, up from 57% in the 2010-11 school year.

What percentage of people are English learners in the US?
Data that includes adult English learner statistics is harder to come by, since not all adults are tested and classified in the same way as students.
A paper published by the Lexington Institute in 2013 stated that there were 23 million adults in the US with limited English proficiency. 2.9 million of them were native-born, while 20.1 million were foreign-born.
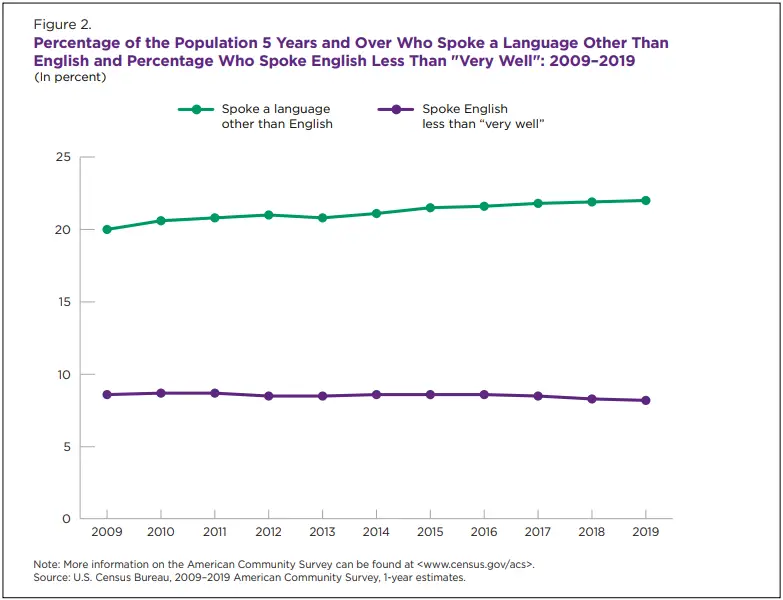
More recently, data from the 2019 US census asked people whether they spoke a language other than English at home, and if so, how well they spoke English.
The results showed that 78% of the US population over 5 years old speaks only English at home. Of the remaining 22%, 62.4% speak English ‘very well’ and 5.8% ‘not at all’.
Here are the full results:
| If you speak a language other than English at home, do you speak English: | Number of people | Percent of this category | Percent of US population |
|---|---|---|---|
| Very well | 42,308,663 | 62.4% | 13.7% |
| Well | 12,543,434 | 18.5% | 4.1% |
| Not well | 9,017,712 | 13.3% | 2.9% |
| Not at all | 3,932,536 | 5.8% | 1.3% |
This suggests that almost 4 million people in the US speak no English at all; that’s 1.3% of the total population.
25.5 million people in the US do not speak English ‘very well’, representing 8.3% of the population.
Note that these are not exactly statistics on English language learners in the US, since not all of these people would necessarily be classed as English language learners according to their state’s definition.
The census also looks at ‘limited English-speaking households’, defined as a household where there are no members aged 14 and over who speak only English or speak English ‘very well’.
19.6% of households that speak a language other than English at home are classed as limited English-speaking households.
This means that almost 5.3 million households in the US (4.3% of all households) do not have a member who speaks English very well.
What is the first language of most ELL students in the United States?
75.5% of all EL students speak Spanish as their home language as of fall 2020, according to data published by the National Center for Education Statistics.
The next most common home language is Arabic, with just 2.6%.
English comes in third, with 2.5%. Students in English-speaking households may be classed as English learners if, for example, they have been adopted from a country or household that speaks another language, or if they are from a multilingual household and the non-English language is their dominant language.
Here are the top 10 languages spoken by ELL students in the US:
| Home language | Percent of EL students |
|---|---|
| Spanish, Castilian | 75.50% |
| Arabic | 2.60% |
| English5 | 2.50% |
| Chinese | 1.90% |
| Vietnamese | 1.50% |
| Portuguese | 0.90% |
| Russian | 0.70% |
| Haitian, Haitian Creole | 0.60% |
| Hmong | 0.60% |
| Urdu | 0.50% |
The Department of Education reports that Spanish is the dominant EL language in most states, with a few exceptions:
- Alaska: Yupik languages
- Hawaii: Iloko
- Maine: Somali
- Montana: German
- Vermont: Nepali
In total, there are over 400 languages spoken in US public schools.
We can also look at the 2019 census data, which shows the main household language of limited English-speaking households (those that do not have a member aged 14+ who speaks English very well).
This data includes the entire population, not just students. In 48% of these households, the main householder is aged 65 or older.
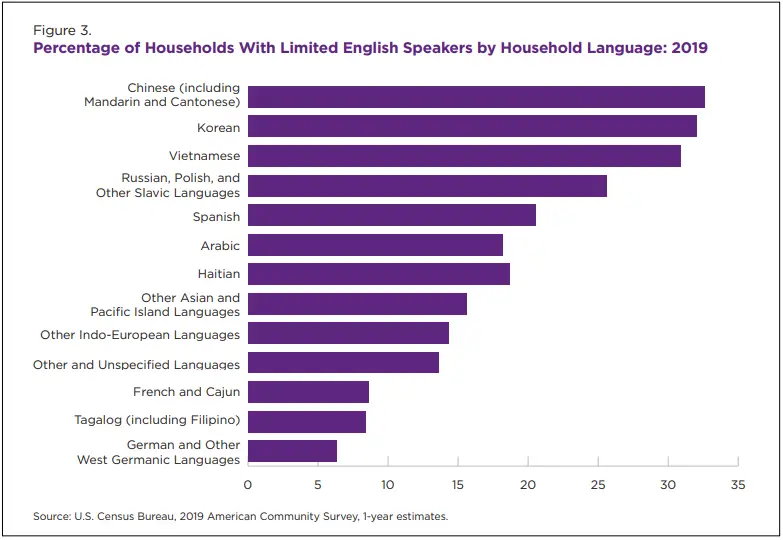
Asian languages take the top 3 places on this list: Chinese first, followed by Korean and Vietnamese.
The difference in demographics means Spanish is lower on this list, as well as the fact that the majority of people who speak Spanish at home (61.4%) also speak English very well.
English learners statistics by state
Next, we have some facts about English language learners in the US by state.
Which state has the most ELL students?
California has the most ELL students, with 1,062,264 enrolled in 2020, according to NCES data. Texas is a close second, with 1,034,543. Florida, in third place, has only about a quarter as many.
Here are the top 10 states by number of ELL students:
| State | Number of EL students, 2020 |
|---|---|
| California | 1,062,264 |
| Texas | 1,034,543 |
| Florida | 264,546 |
| New York | 239,954 |
| Illinois | 218,480 |
| Georgia | 125,963 |
| Washington | 125,822 |
| Virginia | 117,553 |
| North Carolina | 114,901 |
| New Jersey | 95,042 |
Looking at the percentage of students enrolled who are classed as English language learners, Texas is top of the list, with 20.1%. California is second, with 17.7%, and New Mexico is third, with 16%.
These are the top 10 states by the percentage of EL students:
| State | ELL students as a percentage of all students |
|---|---|
| Texas | 20.1% |
| California | 17.7% |
| New Mexico | 16.0% |
| Nevada | 13.7% |
| Rhode Island | 12.2% |
| Illinois | 12.0% |
| District of Columbia | 12.0% |
| Washington | 11.8% |
| Alaska | 11.0% |
| Delaware | 10.7% |
West Virginia comes very last on this list, with only 0.7%.
Here are the same English language learner statistics visualized on a map:
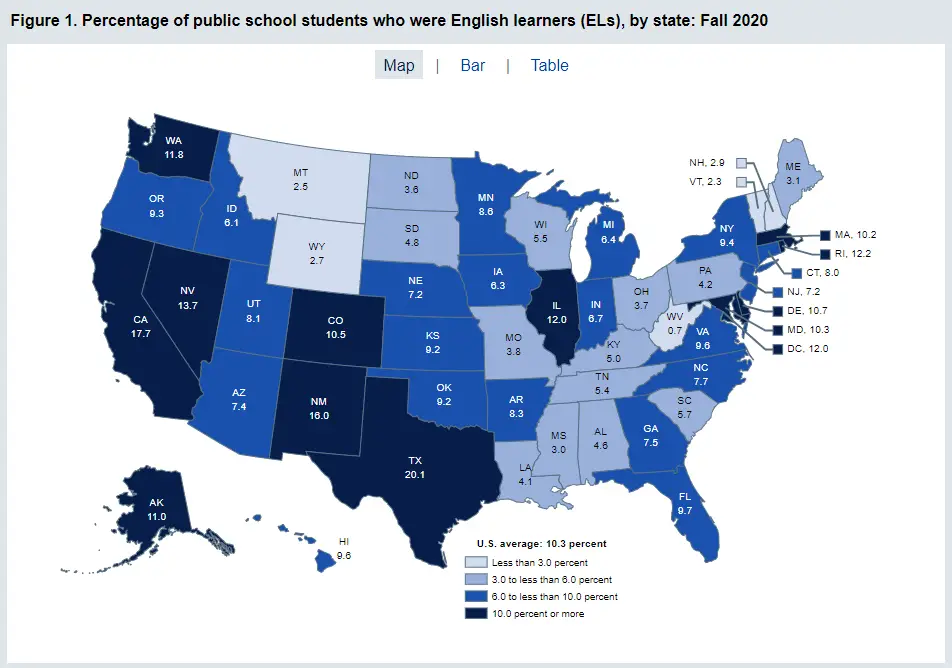
This data also shows that the percentage of EL students is higher for school districts in more urbanized areas.
The number of EL students as a percentage of total public school enrollment in 2020 was:
- Cities: 13.7%
- Suburban areas: 10.0%
- Towns: 7.2%
- Rural areas: 4.4%
It’s also interesting to look at statistics on the increase in English language learners in United States Schools over the past 10 years.
Across all states, the average increase is 10.23% over the past 10 years; from 4,455,860 in 2010 to 4,963,388 in 2020.
Although California has the most ELL students currently, it is also the state with the largest decrease over the past decade, having dropped by 38.8% from 1,474,250 in 2010.
Here are the 10 states where the number of ELL students increased the most between 2010 and 2020:
| State | ELL students 2010 | ELL students 2020 | Percentage change |
|---|---|---|---|
| Louisiana | 11,698 | 27,339 | 57.2% |
| Mississippi | 5,620 | 13,127 | 57.2% |
| Rhode Island | 7,655 | 16,684 | 54.1% |
| Delaware | 6,858 | 14,581 | 53.0% |
| Maryland | 45,500 | 88,834 | 48.8% |
| Kentucky | 16,351 | 31,842 | 48.6% |
| Alabama | 17,559 | 32,630 | 46.2% |
| New Jersey | 52,771 | 95,042 | 44.5% |
| District of Columbia | 5,261 | 9,347 | 43.7% |
| Tennessee | 29,681 | 51,568 | 42.4% |
And here are the 10 states where the number of ELL students decreased the most between 2010 and 2020 (and, in fact, the only 10 that recorded a decrease):
| State | ELL students 2010 | ELL students 2020 | Percentage change |
|---|---|---|---|
| California | 1,474,250 | 1,062,264 | -38.8% |
| Nevada | 83,352 | 64,601 | -29.0% |
| Hawaii | 19,092 | 16,769 | -13.9% |
| Oregon | 58,946 | 52,230 | -12.9% |
| Colorado | 99,804 | 90,155 | -10.7% |
| Alaska | 14,963 | 13,894 | -7.7% |
| New Mexico | 52,557 | 49,497 | -6.2% |
| West Virginia | 1,788 | 1,686 | -6.0% |
| Wyoming | 2,602 | 2,531 | -2.8% |
| Wisconsin | 43,638 | 43,359 | -0.6% |
Returning to the 2019 census data, which looks at the entire population, we can see that the states with the highest percentage of people who speak a language other than English at home:
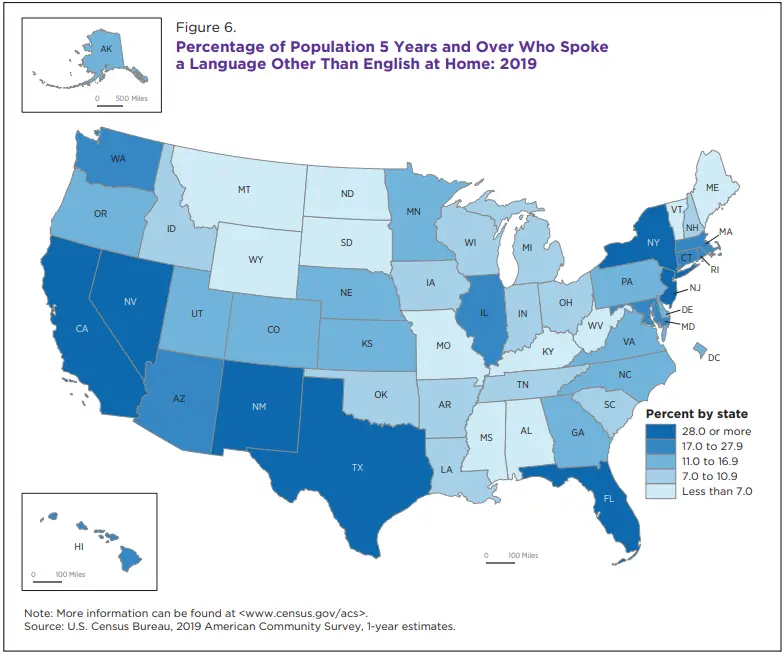
The states with the highest percentage are California, Nevada, New Mexico, Texas, Florida, New York, and New Jersey, all with at least 30% of the population speaking a non-English language at home.
In Mississippi, Montana, and West Virginia, over 95% of the population speaks only English at home.

English language learner statistics around the world
English is the most-spoken language in the world. It doesn’t come first in terms of the number of native speakers (that prize goes to Mandarin), but there are over 1 billion non-native English speakers worldwide.
How many people speak English as a second language?
A report from British Council in 2017 suggests that there are 1,929,680,500 people in the world who speak English as an additional language.
Language site Ethnologue put this number at 1,080,000,000 in 2023.
The difference may come from the methodology used and the definition of an ‘English speaker’ as opposed to an ‘English learner’.
In fact, British Council’s report estimates that as many as 5 billion people (67% of the world’s population) are exposed to English, even if they don’t speak it well.
A good example of this is China. An article published in English Today in 2006 stated that although it was often said that 200-350 million people in China knew English, the number who actually used it regularly was more like 10,000. Although these numbers have no doubt increased since then, the point remains the same.
In any case, it’s clear that the world’s English-speaking population is well dispersed around the globe.
The country with the greatest number of ESL speakers is India, with 128,279,412. Second is Pakistan, with 108,036,049, followed by Nigeria, with 103,198,040.
Here is a list of the top 20 countries according to the size of the non-native English speaking population.
| Country | Number of people speaking English as an additional language | As percentage of total population |
|---|---|---|
| India | 128,279,412 | 9.50% |
| Pakistan | 108,036,049 | 48.91% |
| Nigeria | 103,198,040 | 50.05% |
| Indonesia | 85,131,255 | 30.50% |
| Philippines | 63,988,955 | 58.17% |
| United States | 57,594,462 | 16.89% |
| Germany | 45,100,000 | 55.96% |
| Uganda | 39,800,000 | 89.90% |
| France | 38,643,750 | 57.25% |
| Egypt | 32,101,325 | 31.38% |
| Poland | 18,786,459 | 48.79% |
| Ghana | 18,000,000 | 66.67% |
| Thailand | 17,121,187 | 27.16% |
| Italy | 17,000,000 | 28.51% |
| Bangladesh | 16,398,158 | 9.92% |
| Mexico | 15,686,262 | 13.00% |
| Netherlands | 15,250,000 | 90.94% |
| Malaysia | 15,200,000 | 55.94% |
| Turkey | 12,000,000 | 14.96% |
| Zimbabwe | 11,530,710 | 79.86% |
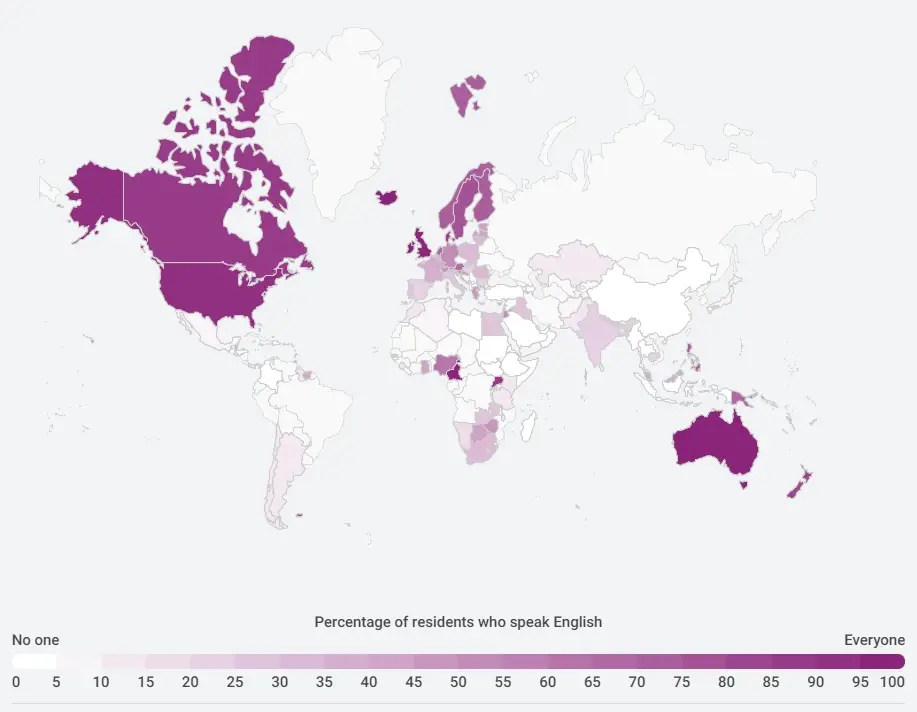
You’ll see that in some countries like Nigeria, the Philippines, Germany, France, and the Netherlands, more than half the population speaks English as a second language.
In other cases it’s a relatively small percentage; either because the majority of the population speaks English as a first language (e.g. the US) or because the overall population is very large (e.g. India).
If being able to communicate with almost 2 billion other people around the world isn’t enough incentive, you can explore some other reasons why it is important to learn English here.
English language proficiency statistics
EF’s English Proficiency Index (EPI) is one of the most comprehensive studies into English language proficiency by country, over time.
The EPI looks at test results from 2.2 million adults in 113 countries and regions.
As of 2023, the country with the highest proficiency is the Netherlands – perhaps unsurprising, as we just saw that over 90% of the population speaks English as a second language.
Singapore takes second place, with Austria in third.
The highest-ranking country in Africa is South Africa, in ninth place, and Argentina is the best-ranked in Latin America, in 26th place.
The following map, published by Statista from the 2021 EPI data, shows the distribution of English proficiency across the globe:
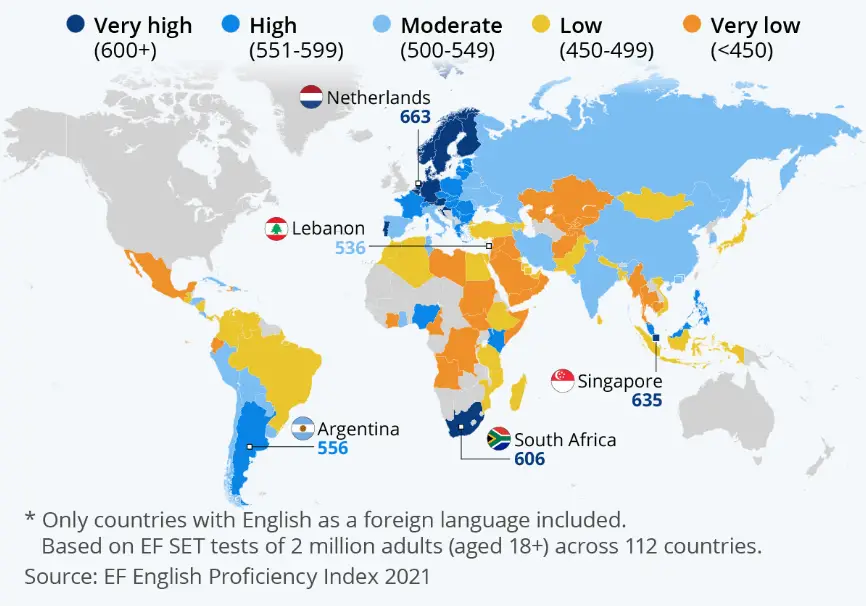
Here is an overview of the top 12 countries in the EPI in 2023, which all get a ‘very high proficiency’ score of over 600:
- Netherlands (647)
- Singapore (631)
- Austria (616)
- Denmark (615)
- Norway (614)
- Sweden (609)
- Belgium (608)
- Portugal (607)
- South Africa (605)
- Germany (604)
- Croatia (603)
- Greece (602)
The global average score is 493.
Looking at global English language proficiency by age, we can see that the 18-20 years group has dropped significantly between 2015 and 2023, from 537 to 448 points.
The group with the most improvement in this time is 31-40 years, increasing by 19 points from 501 to 520.
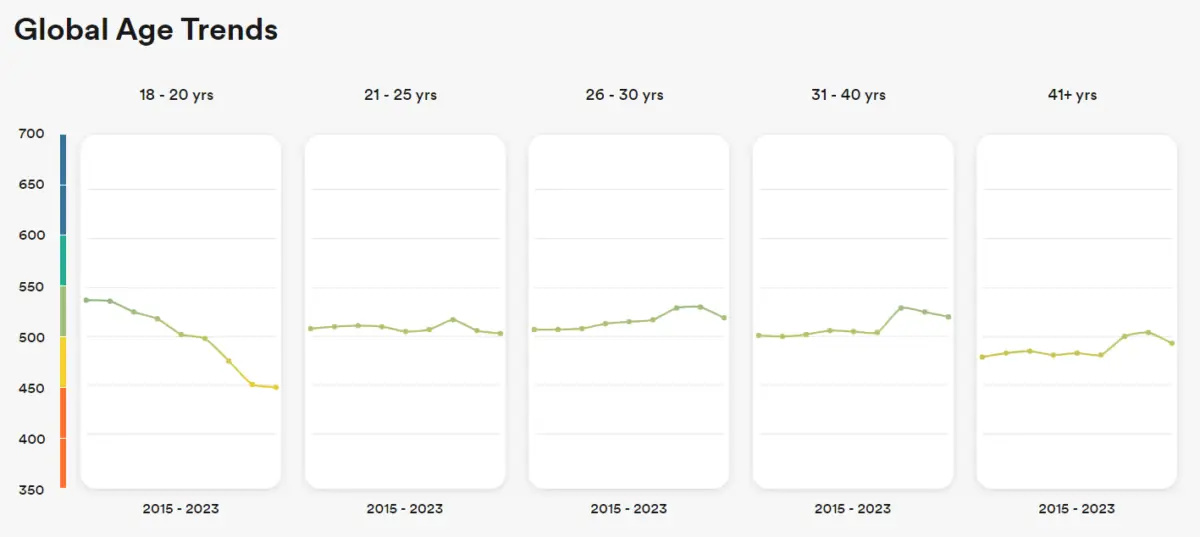
It’s interesting to note how the pandemic may have played a part in these statistics; students who couldn’t go to school were negatively affected, whereas adults who had extra time at home took the opportunity to study English.
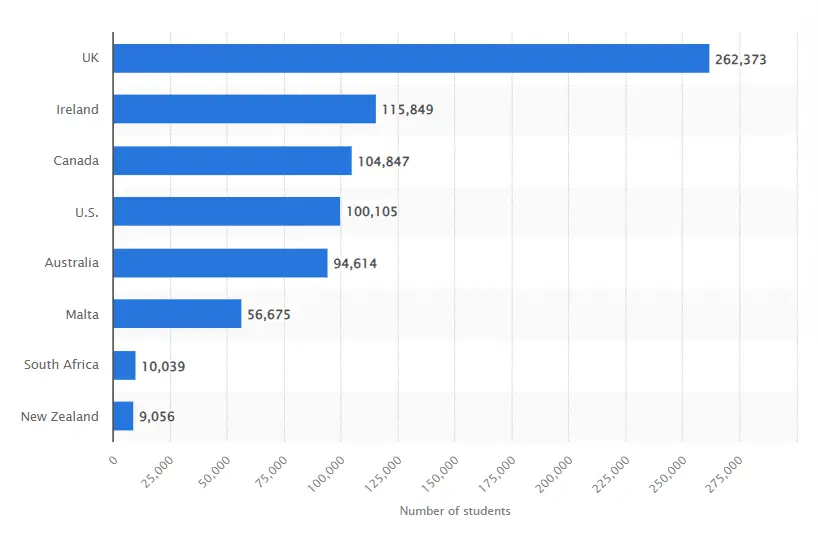
How many people are learning English as a foreign language?
Data published by Statista looked at the number of students learning English as a foreign language (EFL) in a majority English country in 2022.
The UK leads the way, with 262,373 students enrolled, and Ireland comes in second, with 115,849. Canada is in third place with 104,847, and the US is a close fourth with 100,105.
What do English language learners struggle with the most?
Some of the top things that English language learners struggle with are:
- Pressure from graduation requirements
- Low self-esteem and feeling they are behind their peers
- Understanding English pronunciation
- Learning English grammar
- Staying motivated and engaged, especially at secondary school
Read more about why English is so hard to learn here.
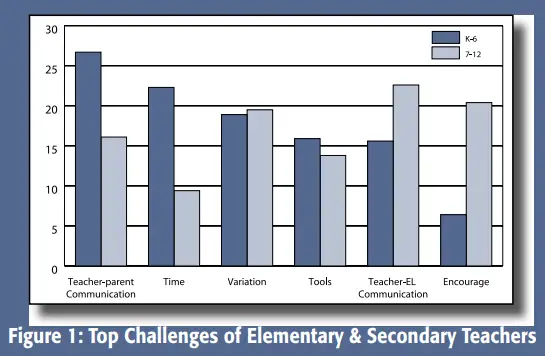
It is also interesting to consider struggles from the perspective of teachers.
A survey of K-12 teachers of English language learners in California found that the top challenge for elementary teachers was teacher-parent communication (27%) followed by lack of time (22%).
The top challenge for secondary teachers was teacher-student communication (23%) followed by encouraging students (21%).
Almost 20% of teachers across the board said variation in student needs and English proficiency was a challenge for them.
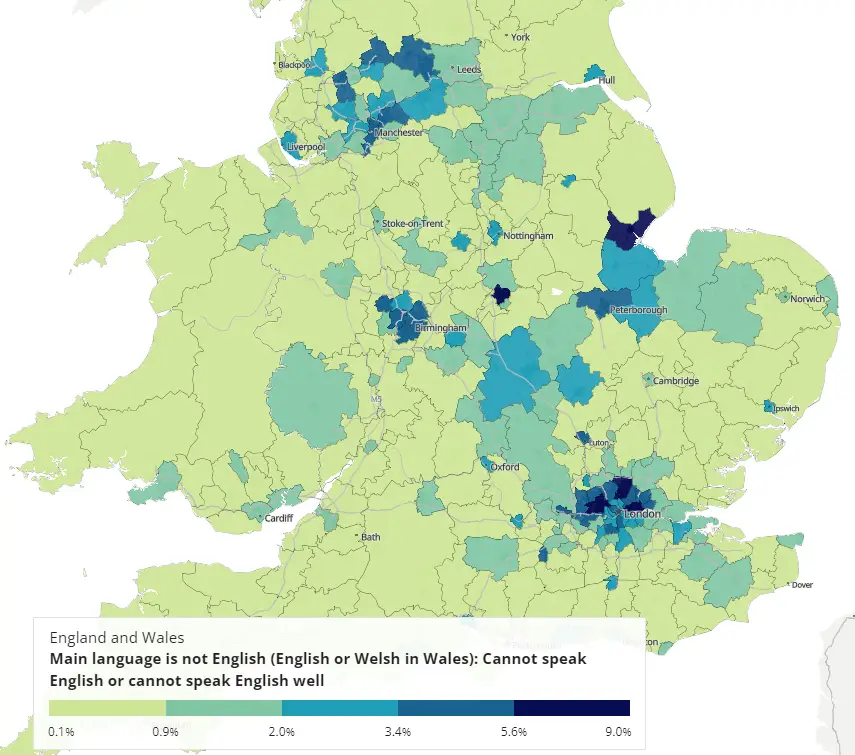
Statistics about English learners in the UK
88.21% of the population of England and Wales speaks English (or Welsh, in Wales) as their main language, according to data published by the Office for National Statistics from the 2021 census.
Of those whose main language is not English or Welsh, 43.9% can speak English very well. The full breakdown of English proficiency is as follows:
| England & Wales population whose main language is not English or Welsh… | Number of people | Percent of this category | Percent of total population |
|---|---|---|---|
| Can speak English very well | 2,255,542 | 43.9% | 3.8% |
| Can speak English well | 1,838,559 | 35.8% | 3.1% |
| Cannot speak English well | 879,782 | 17.1% | 1.5% |
| Cannot speak English | 160,564 | 3.1% | 0.3% |
Overall, only 0.3% of the population cannot speak English at all, and a further 1.5% cannot speak English well.
However, there are certain areas where this percentage is much higher, as shown on the map below. These are concentrated around large cities such as London, Birmingham, Bradford, Manchester, and Leicester.
More ESL statistics and questions answered
What is the difference between ELL and ESL?
An English language learner (ELL) is usually defined as a school student whose limited proficiency in English prevents them from participating in the classroom and achieving acceptable grades. English as a second language (ESL) refers to learning or speaking English in addition to your native language.
Some definitions include adults as English language learners, too.
In which countries is English education mandatory?
English is a mandatory subject in 142 countries in the world where it is not already the main language. These are shown in blue on the map below.
An additional 41 countries offer optional English language education, according to data published by the University of Winnipeg.
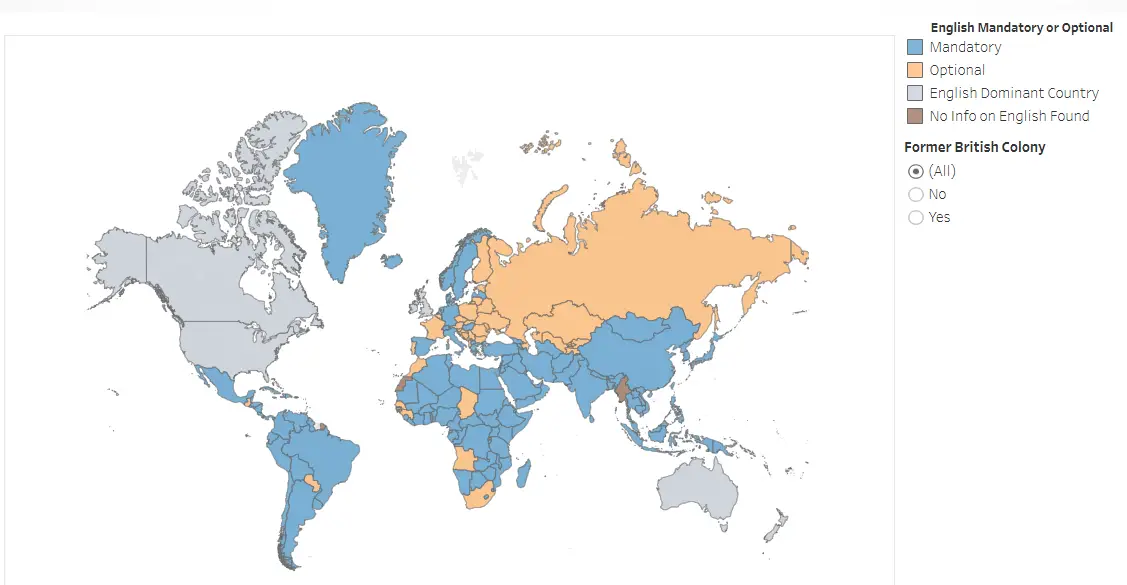
The countries where English is mandatory in schools represent 83.44% of the global population, or 90.3% of the population where English is not a dominant language.
At what age do children start to learn English at school around the world?
23 countries where English is not the dominant language make English-learning mandatory from age 4, while another 23 only make it mandatory at age 12 or above.
The following interactive map, published on Flourish and based on data compiled by the University of Winnipeg, lets you explore the age at which children start learning English in different countries.
Mandatory countries are represented in red, and optional countries in blue. The lighter the color, the earlier they start learning English.
How many words do you need to know to be fluent in English?
You need to know around 5,000 English words to be able to understand 98% of most ordinary texts. However, some sources say that 3,000 words is enough, while others say 10,000 or more are required to learn fluent English.
The discrepancy comes, in part, from the way we count words. For example, are ‘talk’, ‘talking’, ‘talks’, and ‘talked’ four different words, or part of a single word?
And of course, it’s important to know which words are most important to learn, since some are much more useful than others.
If you’re trying to learn more English words, you could start with the the New General Service List (NGSL), which includes 2809 words that cover 92% of most general English texts, or the Oxford 3000.
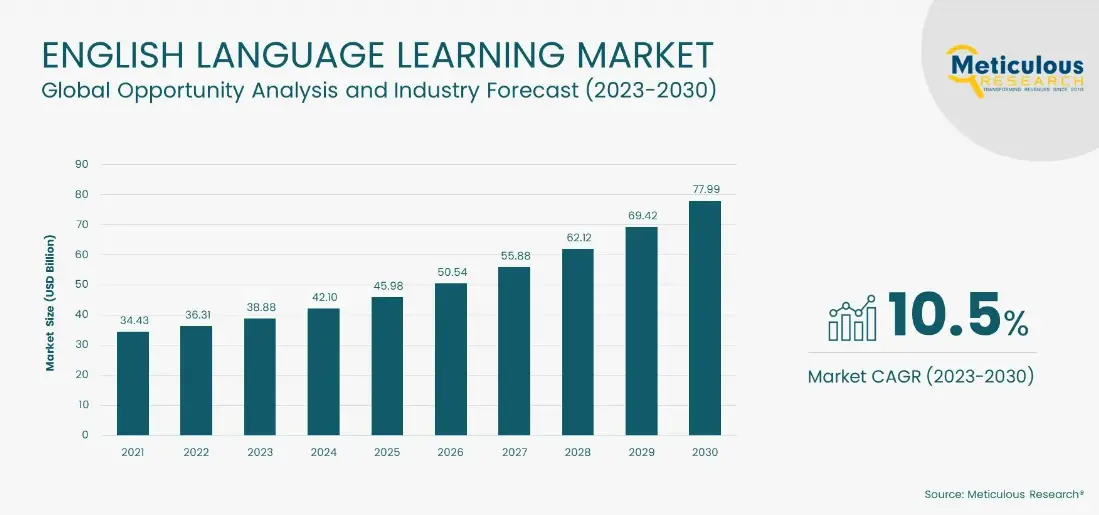
How much is the global English language learning market worth?
Proficient Market Insights valued the global English language learning market at $54.7 billion in 2022, predicting it would increase to $98.3 billion by 2028, representing a CAGR of 10.27%.
A slightly more conservative estimate from Meticulous Research places the value at $38.9 billion in 2023, expanding by a CAGR of 10.5% to reach $78.0 billion by 2030.
The 18-20 years age group is expected to achieve the highest CAGR in this period as English is increasingly needed to collaborate across borders in business settings.
Separate research published on Research And Markets estimates that the English Language Learning market in the U.S. alone was worth $5.6 billion in 2022.
It’s also expected that the online English learning market will grow at a faster rate than the offline market, with more online English courses available than ever before.
China is one of the fastest-growing markets for English learners, with a forecast CAGR of 20.6% between 2022 and 2030 bringing it to a value of $17.9 billion.
If you’ve found this list of ESL statistics useful, you can also check out some statistics about the English language. This article covers the past, present, and future of the language, as well as some business English statistics and interesting facts about the number of words, most common letters, and more.
Sources
Repairing the Nation’s Education System for Adult English Learners
Office for National Statistics
Listening to Teachers of English Language Learners
The Future of English: Global Perspectives
Countries in which English Language is a Mandatory or an Optional Subject
List of countries by English-speaking population
Global English Language Learning Industry Research Report 2023
English Language Learning Market – Global Forecast to 2030
English Language Learning – Global Strategic Business Report